Problem
In industrial plants and laboratory environments, integrating traditional PLCs with custom embedded electronics while making the aggregated data easily accessible in real time is a common challenge. The absence of centralized archiving and independent monitoring hinders immediate response to process deviations, product parameter analysis, and limits the use of historical data.
Solution & System Architecture
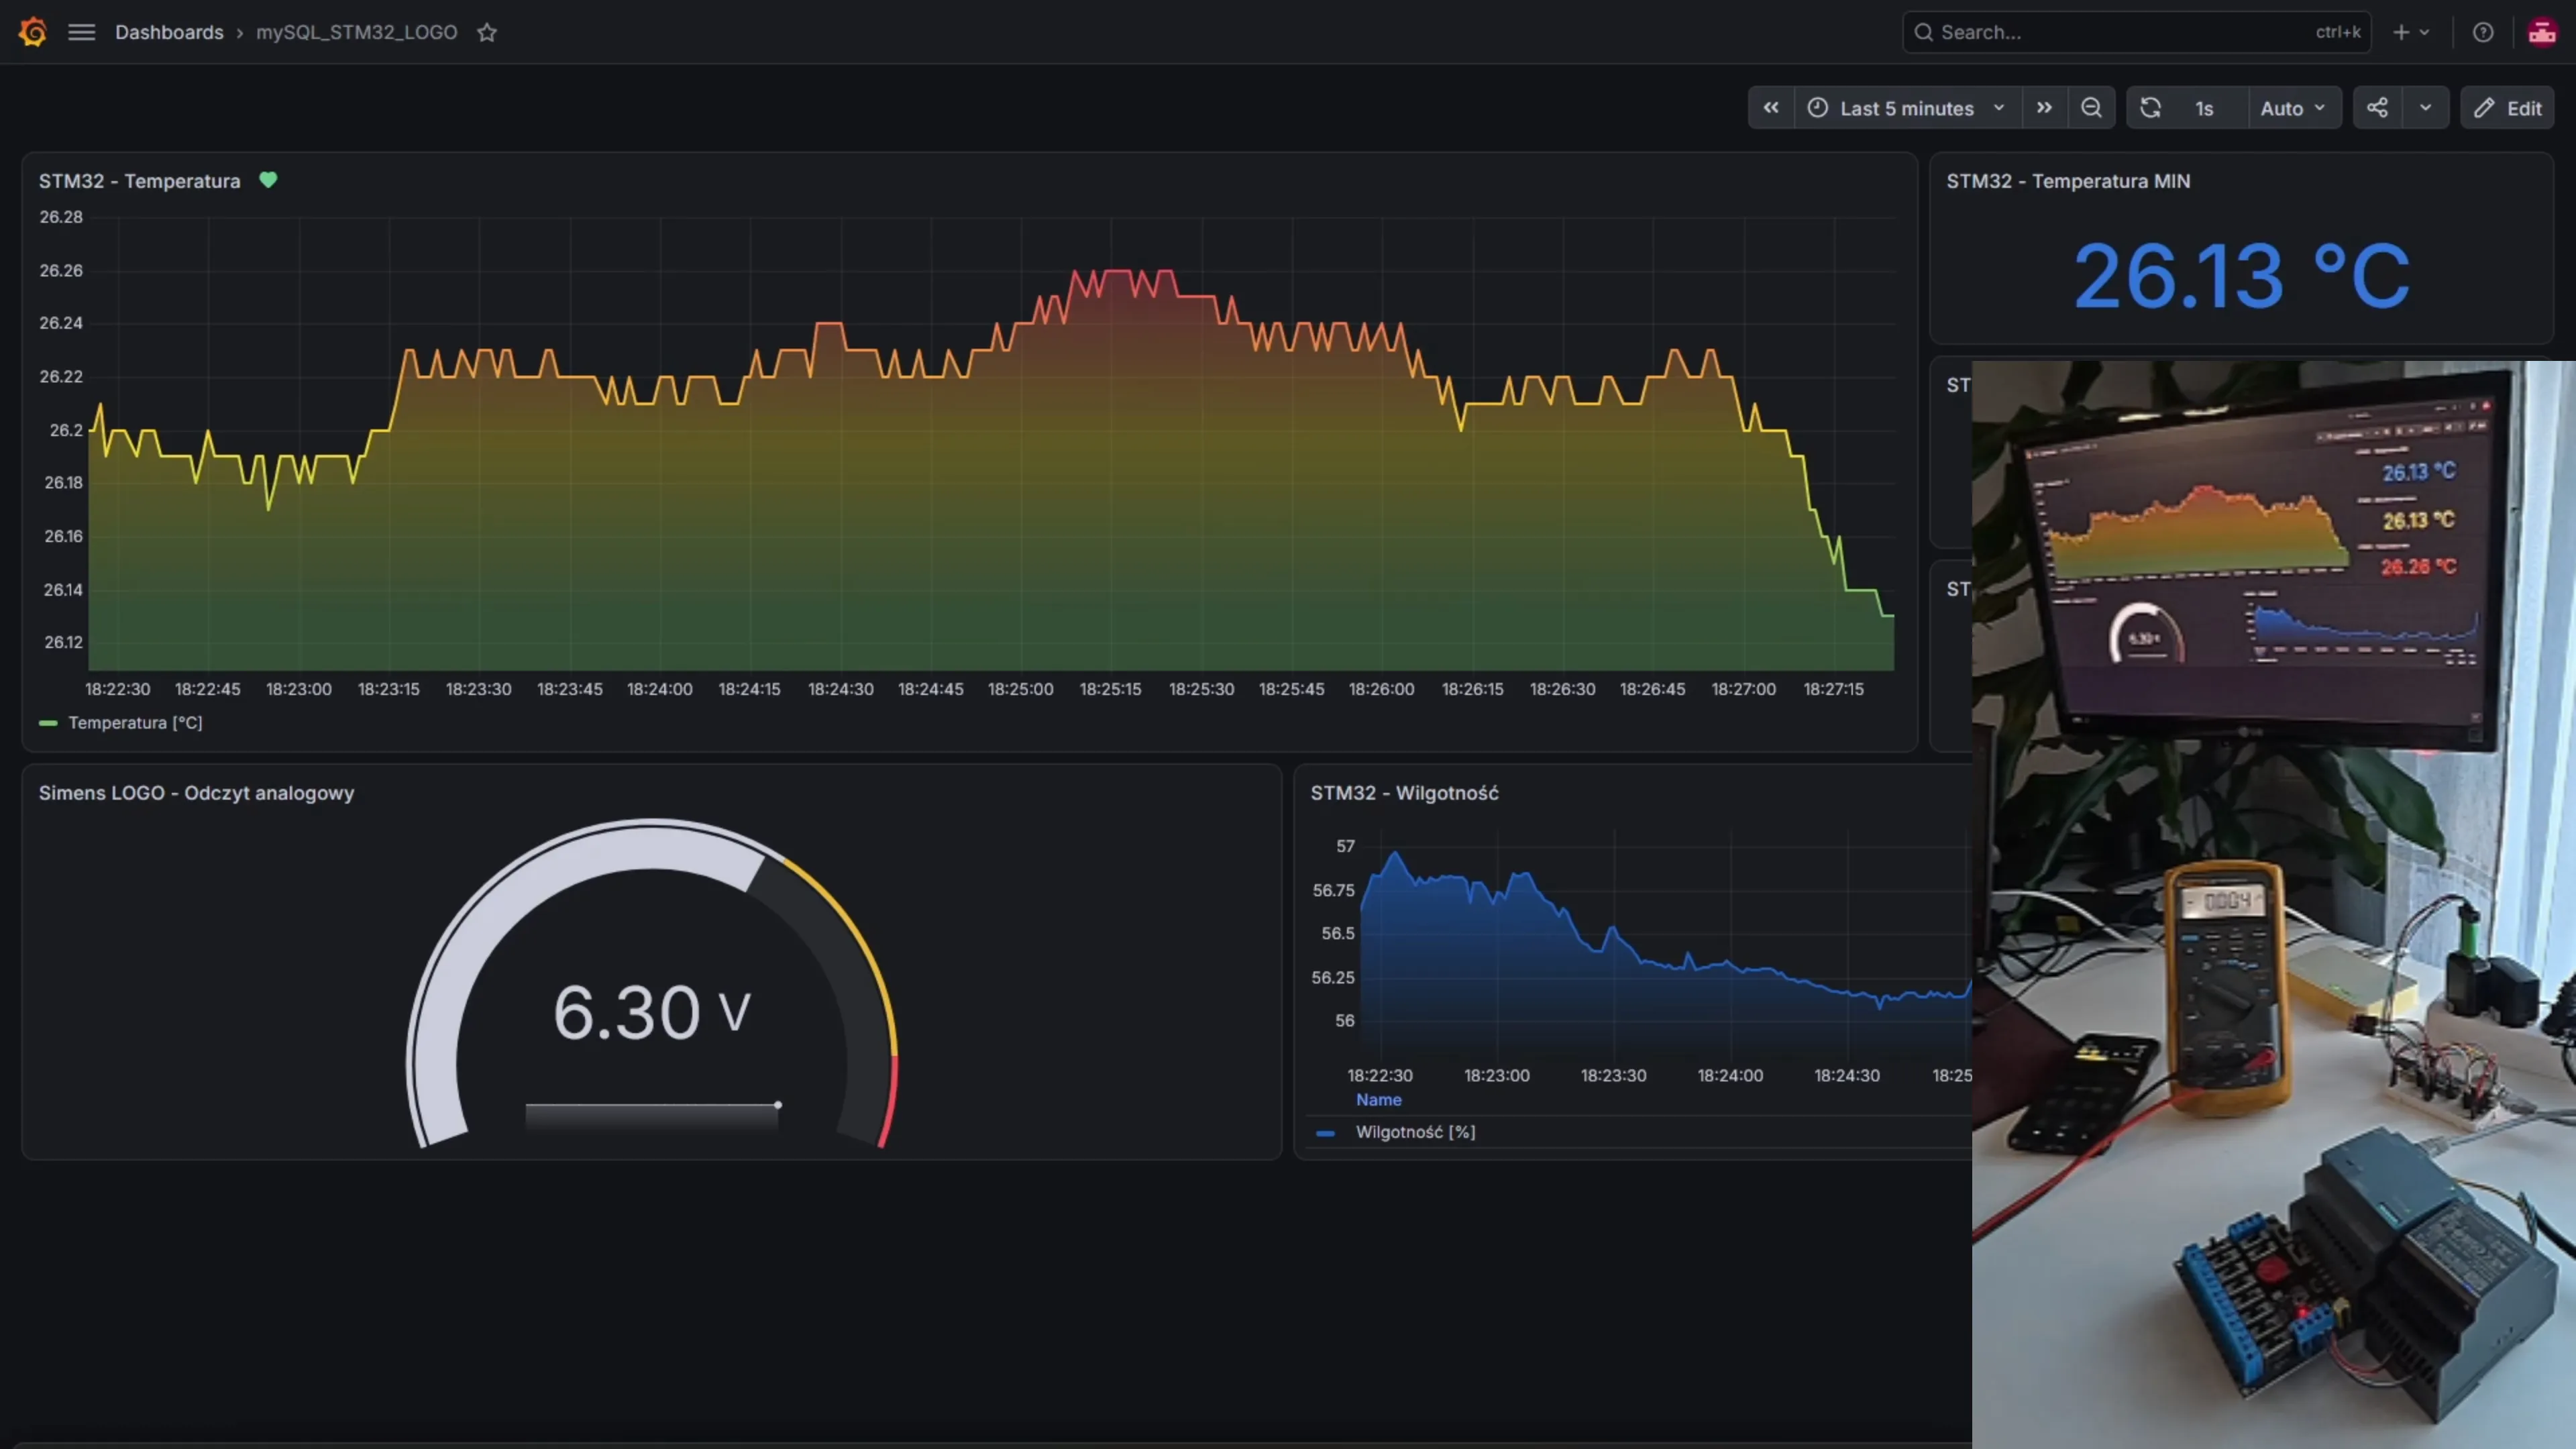
A scalable telemetry system was designed and deployed based on open industrial standards and protocols. The video below demonstrates the complete data pipeline—from a physical sensor to database analytics and real-time reporting:
The built test stand demonstrates a complete data flow based on a multi-tier architecture:
- Hardware & Communication Layer (Modbus TCP): The project utilizes a traditional Siemens LOGO! industrial PLC reading an analog input signal (smoothly simulated via a potentiometer for testing) and a custom embedded board based on an STM32 microcontroller equipped with a BME280 environmental sensor. This module accurately measures air temperature and humidity. All devices are connected to a common local area network (LAN) using Ethernet cables. The communication relies on the Modbus TCP protocol.
- Middleware Engine: The core of the system logic is a dedicated server application written in Python. This program acts as an independent telemetry bridge—it connects to the devices and fetches parameter values at a frequency of 1 second. The retrieved data samples are instantly saved into a MySQL relational database for long-term archiving.
- Live Visualization (Grafana OSS): The Grafana application is directly connected to the MySQL database, from which it continuously reads and visualizes the aggregated metrics. A massive advantage of this software is its web-based nature—the fully customizable dashboard can be opened on any number of devices (workstation monitors, smartphones, tablets) connected to the same local network, without needing to install additional client software on those end nodes. Grafana allows for smooth zooming and time-range adjustments on graphs, quick CSV data export, and features advanced alerting capabilities. Should critical value thresholds be exceeded (e.g., high temperature occurrences), the system can automatically trigger notifications via messengers like Telegram or Email.
- Analytics (Spreadsheets): In addition to dynamic charts, historical data from the MySQL database can be queried directly into spreadsheets (e.g., MS Excel). After refreshing the query, analysts receive a ready-to-use dataset that can be subjected to deep mathematical processing.
Business Applications
The presented application perfectly automates the process of continuous and repeatable data collection at the demanding intersection of PLC systems and flexible Embedded boards. This architecture is an excellent fit for:
- retrofitting classic or outdated machinery—by implementing a discreet Embedded module to capture data and transmit it via Modbus TCP, it completely eliminates the need for manual transcription of results from physical displays by operators,
- advanced measurement systems and handling automated laboratory measurements,
- production lines for in-depth analysis of product parameters and machine behavior,
- serving as a reliable foundation for implementing Statistical Process Control (SPC) in manufacturing plants focused on strict quality control.